
Not Your Parent’s Oil Crisis
Executive Summary
An oil shock today is less macro-destructive than in the 1970s because the economy is less energy-intensive, the U.S. is a net petroleum exporter, and policy frameworks have evolved.
Historical episodes show that most geopolitical shocks fade and markets typically recover once uncertainty clears and the new equilibrium is priced.
The main risks now are higher headline inflation, pressure on consumers and margins, and regional divergence, with Europe and EM energy importers most vulnerable.
The recommended playbook is to keep strategic allocations broadly intact while tactically overweighting energy, commodities, gold, and energy-exporter markets, and underweighting long-duration bonds in importing regions, rate-sensitive growth, EM energy importers, and lower-quality credit.
Introduction
With war intensifying in the Middle East and traffic through the Strait of Hormuz severely disrupted, oil prices have spiked in ways that invite comparisons to the 1970s. Yet an oil shock in 2026 will not feed through to inflation and growth as it did then: the global economy is less energy-intensive, the U.S. is far more energy independent, and monetary policy frameworks are very different. That said, the longer the disruption persists, the greater the risk of higher inflation, weaker growth, and localized fuel shortages. This paper explains why "this time is different" and sets out a practical playbook for investors navigating an extended oil shock.
Historical Perspective — The 1970s Oil Price Shocks
In October 1973, the world's economic order was upended almost overnight. When Arab members of the Organization of Petroleum Exporting Countries (OPEC) imposed an embargo on the United States and other nations supporting Israel in the Yom Kippur War, the price of oil shot up nearly fourfold in a matter of months.
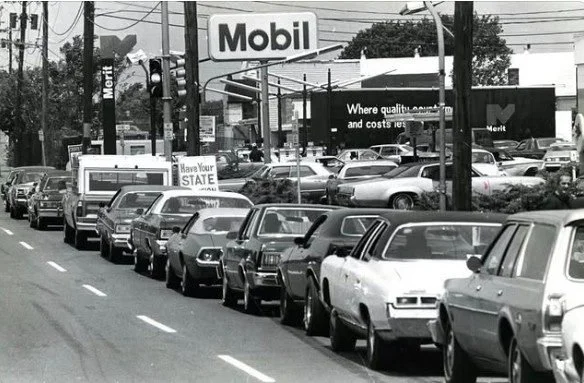
Gas stations across America ran dry, red flags appeared at empty pumps, and drivers sat in lines for hours waiting to fill their tanks. The disruption rippled through every corner of the economy: transportation costs soared, electricity bills climbed, and businesses passed their higher production costs straight to consumers.
The impact on the economy was severe. Consumer prices surged in the early 1970s, with CPI rising from 3.4% in 1972 to over 12% by 1974. The Fed's preferred PCE measure stayed above 3% continuously from 1969 to 1985, underscoring persistent inflation.
At the same time, growth weakened sharply: real GDP fell 2.1% in 1974 and 0.2% in 1975, with the recession erasing 3.2% of output. Unemployment jumped from 5.6% to 8.5%, peaking at 9%, as 2.3 million jobs were lost and long-term unemployment more than doubled.
Then, just as the economy was finding its footing, a second shock arrived. The Iranian Revolution of 1979 toppled the Shah and sent Iranian oil output plummeting, triggering panic buying and speculative hoarding that drove crude prices from $13 a barrel in mid-1979 to over $34 by mid-1980, with spot prices briefly touching $50.
Headline CPI surged past 13% in 1979 and inflation peaked at nearly 15% by early 1980, forcing newly appointed Fed Chairman Paul Volcker to slam the brakes — raising the federal funds rate to a peak of 19% in 1981 to finally break inflation's grip. The cure proved nearly as painful as the disease: the resulting recession was the most severe since the Great Depression, and unemployment climbed to nearly 11% by November 1982.
Together, the two oil shocks of the 1970s left an indelible mark — reshaping energy policy, central banking, and the public's understanding of how deeply the price of a single commodity could shake the foundations of the entire global economy.
It would make sense for today's investors to draw parallels to the historical energy shocks of the 1970s as events unfold today in the Middle East. After all, the actors are all the same and we are definitely seeing historical parallels. As Mark Twain once said, "History doesn't repeat but it often rhymes." And in this case, there are some very important distinctions that should be drawn between what happened in the 1970s and what is happening today and the implications for your investment portfolio.
Oil and US GDP have changed
The oil intensity of global GDP has plummeted since its 1970's peak and is only half the level it was at the time of the Gulf War in 1990. Even the natural gas intensity of GDP has declined since 1980 despite natural gas consumption tripling since then.
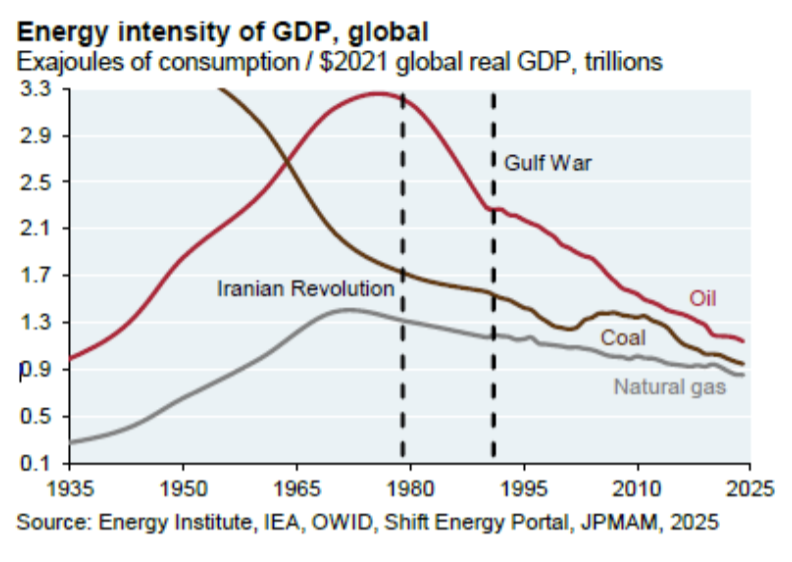
The primary drivers of these declines are substantial improvements in energy efficiency, a shift from coal to more efficient combined cycle gas turbines and renewable energy used for industrial power needs, building HVAC, and transport via EVs and biofuels. The benefit of reduced oil intensity is that the impact of oil shocks on GDP and S&P profits is lower than it used to be.
Because US GDP is less oil dependent, the impact of higher oil prices is diminished this time around. Goldman Sachs Chief Economist Jan Hatzius estimates that if Hormuz opens by mid-April, the U.S. economy will be 0.4% smaller in a year than without the closure. In other words, the U.S. will have modestly slower growth but no recession.
The US is an exporter and energy independent
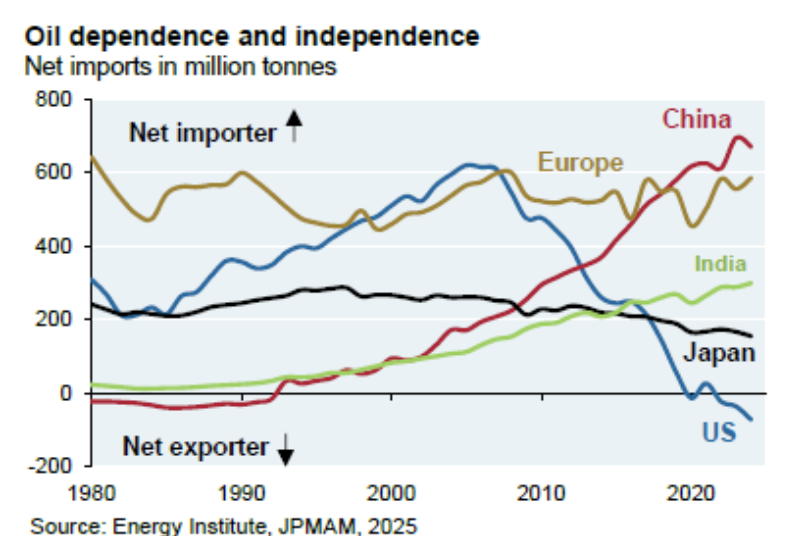
The US simultaneously imports and exports oil, because American refineries are configured for heavy, sour crude (which must be imported, mainly from Canada and the Middle East) while domestic shale produces light, sweet crude that is exported. When you include refined petroleum products (gasoline, diesel, jet fuel, etc.) alongside crude oil, the U.S. actually becomes a net petroleum exporter.

Total US petroleum and products exported – 10.7 million bpd in 2025
Total US imported – 7.9 million bpd in 2025
Net 2.8 million bpd in 2025
Canada is by far the largest source (around half or more of total U.S. petroleum imports), with Mexico next, then Saudi Arabia, Iraq, Colombia, and smaller shares from other Latin American, OPEC, and non‑OPEC countries. About 10% of US oil imports are from Saudi Arabia and Iraq.
Being a net petroleum exporter means higher oil prices are less damaging to the U.S. macroeconomy than in the pre-shale era. The offset to higher oil prices paid is higher oil revenue received by the oil and gas industry, as an example. However, the U.S. still net imports crude specifically (~2.2M bpd), so gasoline prices still rise with global crude, which squeezes consumers and non-energy corporate margins.
Monetary policy: then vs. now
In the 1970s, central banks pursued multiple, often conflicting goals (growth, employment, and price stability) and tended to tolerate more inflation to support activity, contributing to the "stop-go" pattern and the Great Inflation. Policy was less rules-based and more discretionary, with the Fed often keeping real policy rates around zero and allowing money growth to stay high, which unanchored inflation expectations. Since the Volcker era, most advanced-economy central banks have adopted explicit or de facto inflation-targeting frameworks, with price stability as the primary objective and clearer communication and accountability. Inflation expectations are now better anchored, and central banks are more willing to raise rates preemptively to preserve credibility, even at the cost of slower growth.
How do markets react historically?
Most geopolitical shocks fade from markets quickly. When wars erupt, markets stumble. It is not necessarily the conflict itself that causes the panic but rather the uncertainty. Investors don't know how long it will last or how bad things will get. We are certainly experiencing that now with the events in the Middle East.
History shows us that once the fog of war lifts, markets recover and often faster than you would expect. Across six major conflicts, from World War II to the Iraq and Afghanistan wars, US large-cap and small-cap stocks have not only recovered, but often outperformed their peacetime averages. During World War II, small-cap stocks surged by over 30%. Even during the Korean War, markets delivered double-digit returns.
Why? Because once the initial shock wears off, markets begin to price in the new reality. Governments often increase spending, particularly in defense and infrastructure, which can stimulate economic activity. Certain sectors, like energy, defense, and manufacturing, may even benefit directly.
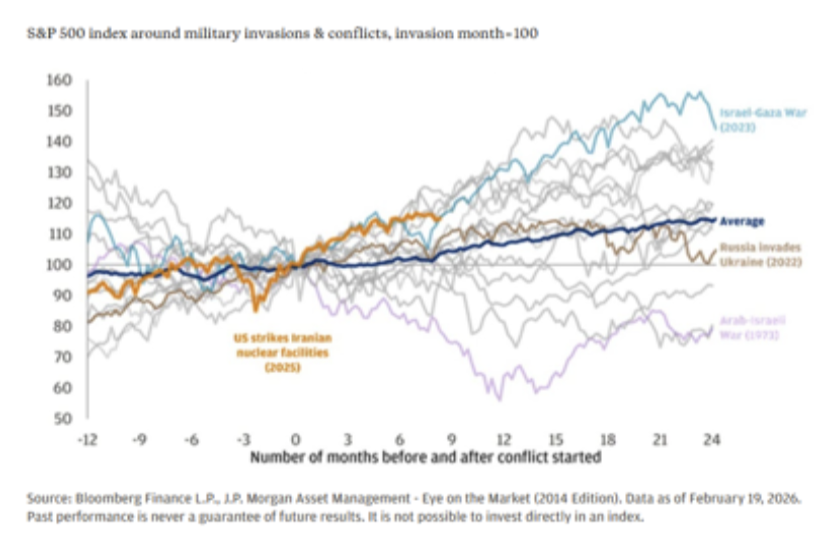
However, it should be noted that the risk of recession rises the higher the price of oil climbs and the longer that it stays elevated. When oil prices rise more than 100%, the S&P 500 index typically suffers substantial corrections. JPMorgan Equity Strategy & Quantitative Research estimated that for every 1 million bpd of oil that is removed from the system, the price per barrel increases by $4. And a sustained $10/barrel rise in oil trims about 0.2% to 0.3% from US real GDP over the next year. The higher oil prices act like a tax on consumers and businesses, but the drag to GDP is partly offset by gains to domestic energy producers.
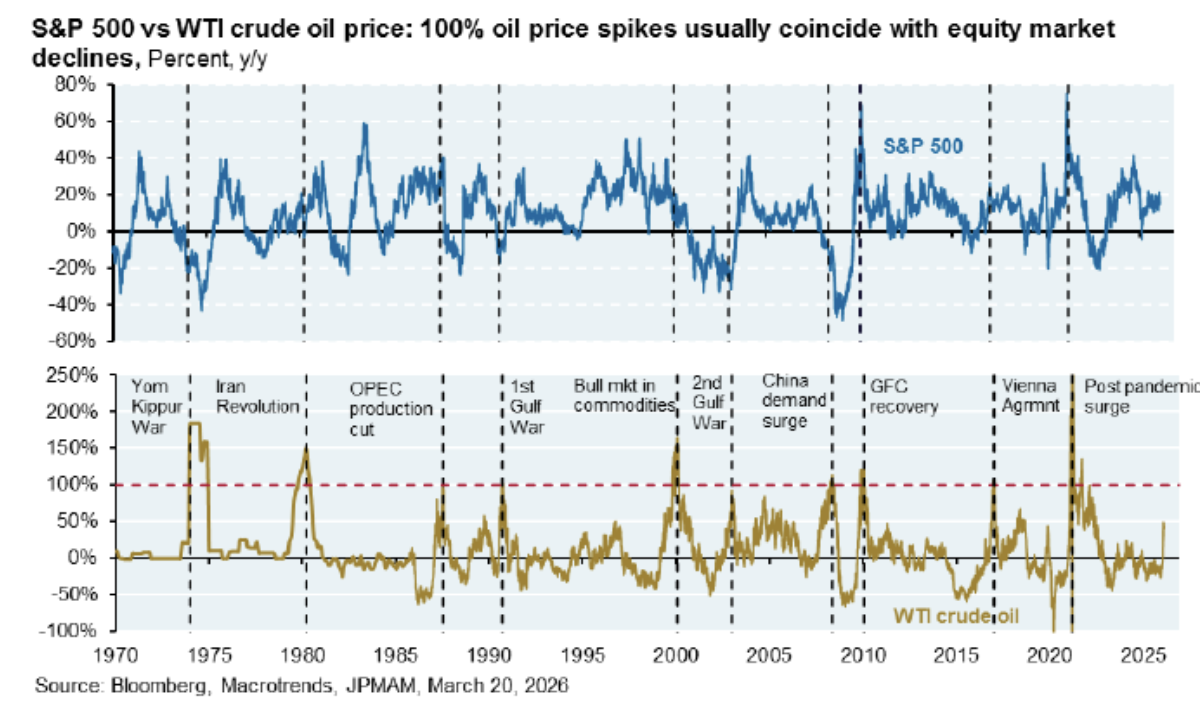
The key element in this analysis, or the key rhyme as it were, is how long the crisis lasts.
How to position your portfolio
It's not clear when the conflict in Iran will end, and volatility is likely to persist in the near-term, but some of the pain points are clear. History has proven that equity markets recover quickly and often benefit after a conflict from increased defense and infrastructure spending. For long term investors, we would recommend staying the course with a balanced portfolio.
For nervous investors, trimming exposure in Europe and Asia, where the epicenter of the pain is, might provide an opportunity to pull back on risk. And if higher energy prices persist with an upside shock to inflation, investments in infrastructure and gold offer long-term potential to diversify and offset geopolitical risk.
And finally, for investors that would like to be more tactical, there are certainly interesting opportunities. The clear winner in this conflict is defense and we can expect increased spending on defense and specifically drone technology.
Tactical suggestions
Overweight:
Energy equities (integrated oil & gas, E&Ps with good balance sheets, midstream)
Broad commodities and gold (as inflation and geopolitical hedges)
Defense sector (drone and missile technology)
Equities in energy‑exporting, less rate‑sensitive markets (select U.S., Canada, Norway, Middle East ex‑front‑line, some Latin America)
Short‑duration, high‑quality bonds and cash (dry powder, inflation and volatility buffer)
Underweight:
Long‑duration nominal government bonds in energy‑importing regions (Europe, Japan) given stagflation risk
Rate‑sensitive growth equities (unprofitable tech, long‑duration stories) and highly levered cyclicals exposed to higher input costs
EM equities and FX heavily dependent on imported energy, especially in Asia and parts of Europe
Lower‑quality credit where spreads do not yet reflect recession and refinancing risks
